An algorithm for calculating the square root of a number

By Tutor GuyNo Comments


How do you find the square root of a number? You use a calculator, of course! But what if you can’t find your calculator? Did you know there’s an algorithm that will allow you to derive a square root of a number? My dad taught it to me a long time ago before calculators were around. It would surprise me if anyone you know under the age of 40 has ever seen it. It’s a slow, painstaking process, so only use it if you have a lot of time to waste. Frankly, I’d recommend waiting until you get a new calculator, but in case you’re interested, here it is. It’s easiest to explain with an example. Let’s find the square root of 300. Because we want to calculate some digits after the decimal point, we will write it as 300.0000

\sqrt{300.0000}

The first step is to separate the digits into groups of two. Starting from the decimal point, mark off each pair of digits. If there are an odd number of digits to the left of the decimal point, the leftmost digit will be a single digit and not a pair. Then start from the decimal point again and count off the digits to the right by twos. In our example, the “3” in 300 is a single digit and all the others are pairs.


Now we are ready to calculate. Our first digit is a three. We find the largest integer whose square is less than this number. Since 12 = 1 < 3 and 22 = 4 >3, our number is 1. We place a 1 above the 3, just like we are doing a long division problem.


Next, copy this digit on the line below the 300.


This next step looks a lot like a long division problem. Multiply the (red) 1 by the (tan) 1 and put the product under the 3. Then subtract, and bring down the next two digits. Our example will look like this:


Now it gets a little strange. Take the (red) number above the 300 and double it. Write this number on the next line down on the left and add an underscore. 1 doubled is 2, so our example now looks like this:


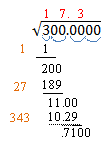
The underscore is a place holder for an unknown digit. We need to find a single digit that we will place above the line (over the “00”) and in the placeholder. We want the product of these two numbers to be as large as possible without being larger than the current remainder. Let’s say we decide the digit is 6. Then 6 ·26 = 156. If the digit is 7, then 7 ·27 = 189. If the digit is 8, then 8 ·28 = 224. This is larger than 200, so our digit is 7. We place it above the radical and in the placeholder as shown below. Do the multiplication and subtraction as before. Write the remainder and bring down the next two digits. Our example now looks like this:


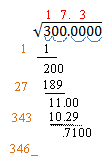
Now we repeat this process over and over for each new digit. Double the number above the radical and add a placeholder. 17 ·2 = 34, so our problem now looks like this:


Again, we need a digit above the line and in the placeholder so that the product is less than the remainder. 3·343 = 1029 < 1100.   4·344 = 1376 >1100. So the digit we want is 3. Do the multiplication and subtraction and bring down the next two digits. Our example looks like this:


Let’s do it one more time. Double the number over the radical and add a placeholder:


The next digit we need is a 2. (2·3462 = 6924 < 7100; while 3·3463 = 10389 > 7100). Multiply and subtract and bring down the next two digits.


17.32 is a pretty good approximation of the square root of 300. You can repeat this process as often as you want to get even more digits in your solution. The next number we would write on the left would be 3464_. You can see that the number on the left gets bigger with each step, so the process gets pretty unwieldy. If you need more than three or four digits in your square root, make sure you have a lot of paper, or go find that calculator!

Algebra 1, Algebra 2

Graphing sine and cosine functions like a pro

By Tutor GuyNo Comments


When graphing a sine or cosine curve, the first thing you must do is determine the amplitude, period, phase shift and vertical shift. See my previous post (Graphing Sine and Cosine Functions – Intro) if you need help with this analysis. In this post, we will graph the function

\displaystyle f(x) = -3 \sin (2x + \frac{\pi}{2}) -1

We quickly determine the four values we need:

Amplitude = |-3| = 3

Period = 2 \pi /2 = \pi

Phase shift = -(\pi /2)/2 = - \pi/4  (that is, \pi /4 units to the left)

Vertical shift = -1


This is all the information we need in order to complete the graph. Just follow this procedure step-by-step.

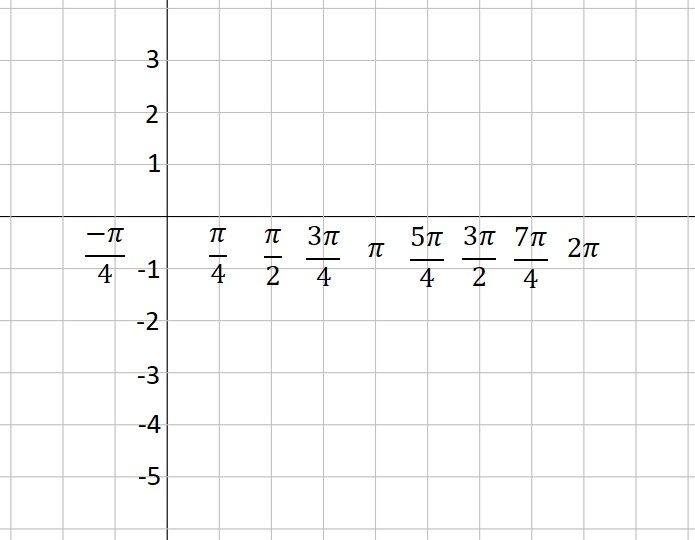
 1. Put values on the coordinate axes. On the y-axis, you typically make each square equal to one unit, but you can change this if you want. To determine the scale on the x-axis, take the period and divide by 4. This will be the scale on the x-axis. In our example, the period is \pi , so each square will be \pi /4 . The vertical axis will be one unit per square. What do you do if your teacher gives you a grid with the numbers already in place? You should get a blank piece of graph paper and do your own grid!
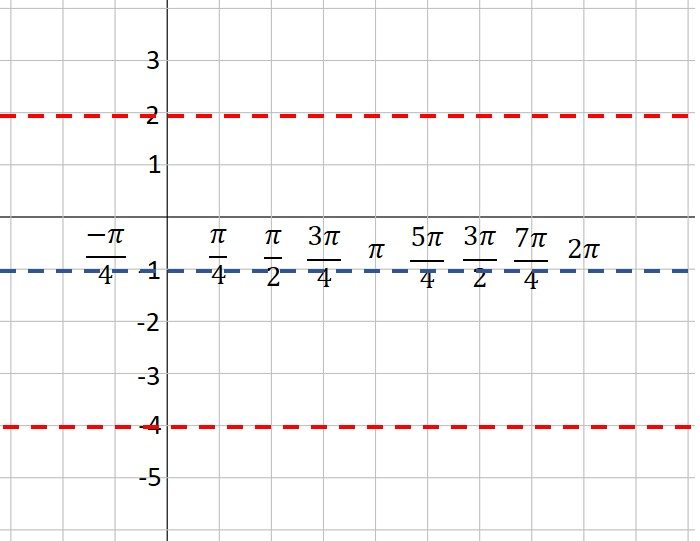
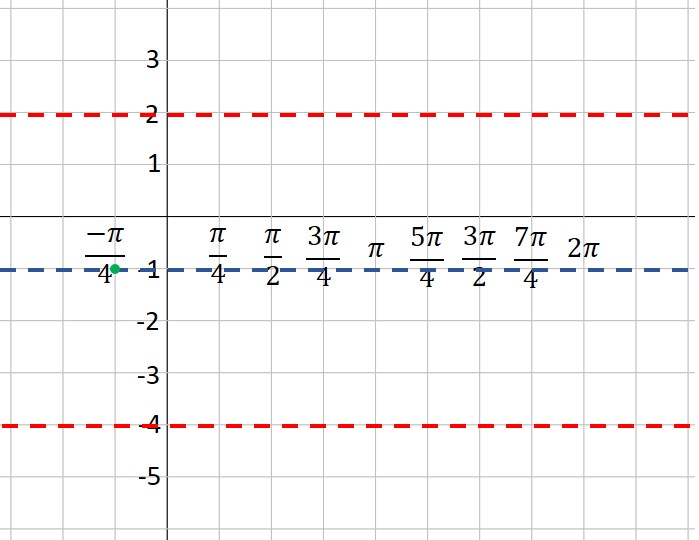
 2. Use the vertical shift to draw a dashed line across the figure. This is the location of the midline of your graph. In our example, the vertical shift is -1, so we draw a dashed line at y= -1.
 3. Use the amplitude to draw two more dashed lines—one above the midline and one below. These represent the maximum and minimum values of your function. In our example, the amplitude is 3. Three units above -1 is 2—that’s our maximum dashed line. Three units below -1 is -4—that’s where our minimum is located.
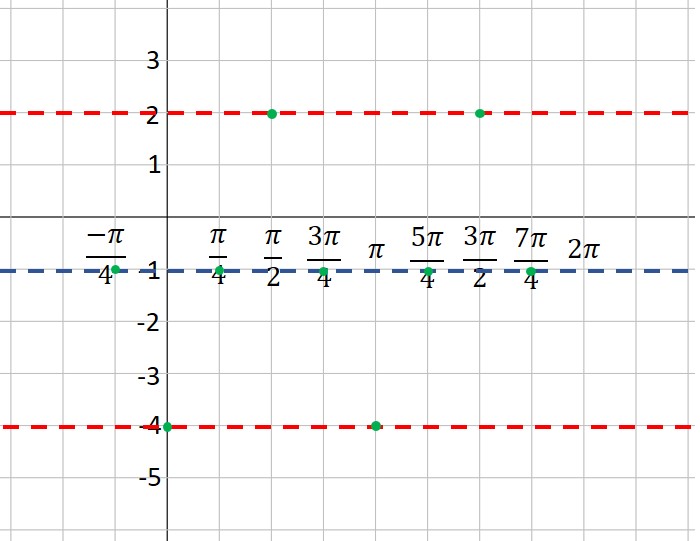
 4. Plot the starting point of your graph, using the vertical shift and phase shift as a guide. Our function is a sine curve, which starts at the midline. The phase shift is \pi /4  to the left, so our initial point is \pi /4  units left of the y-axis. If our function had been a cosine curve, our initial point would be plotted on the maximum line instead of the midline (or on the minimum line if A is negative). It’s hard to see, but note that I’ve placed a green dot at the “start” point; the coordinates are ( - \pi /4, -1).
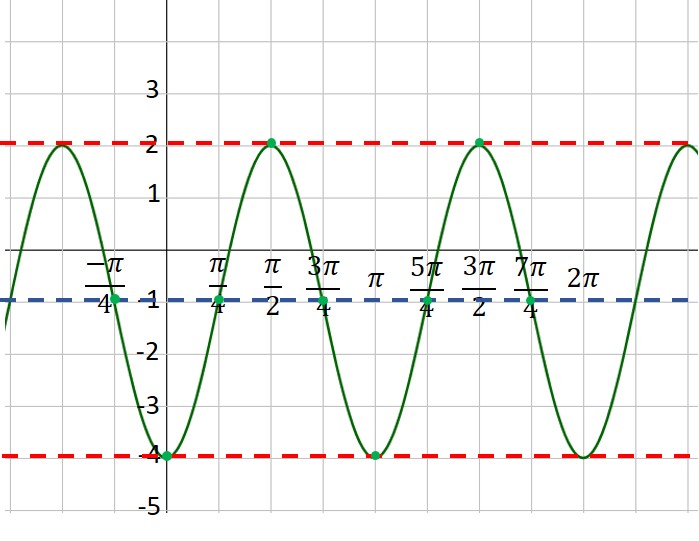
 5. Moving one square to the right at a time (because each square is one quarter of a period), plot points at the maximum, midline, minimum and midline. This is one period of your function. If you want to graph more than one period, continue the process. In our example, we’ve plotted points for two complete periods. Note that because A is a negative number (-3), our first point after the starting point is at the minimum instead of the maximum. Look closely, and you will see that I’ve placed a green dot every square to the right of our first point.

 6. Connect the dots with a nice smooth curve. You’ve graphed the sine curve like a pro!
Algebra 2, Precalc/Trig

Graphing sine and cosine functions– an Intro

By Tutor GuyNo Comments


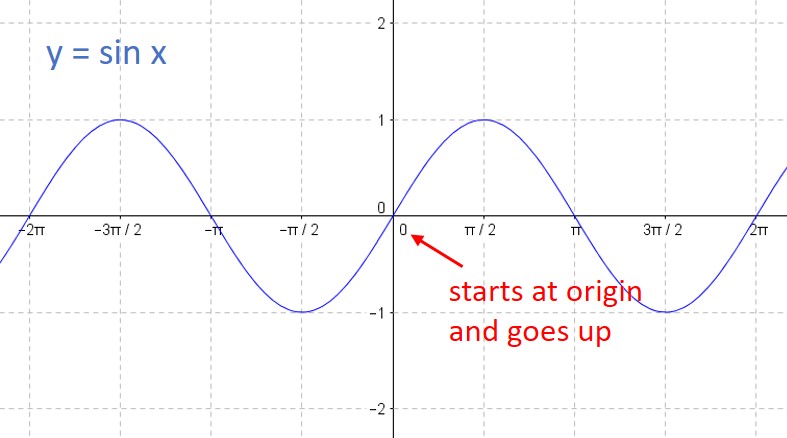
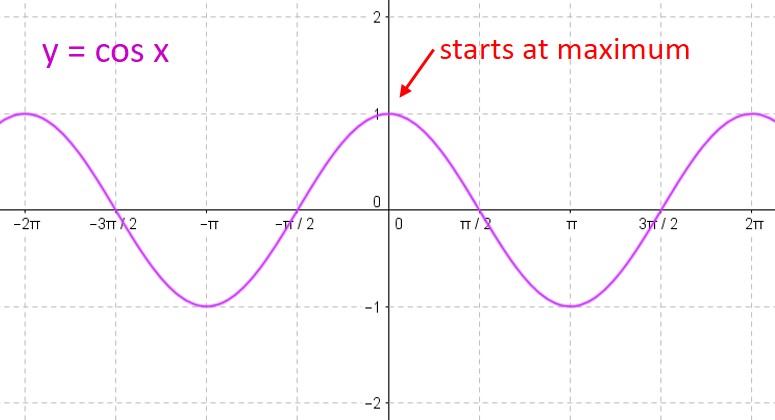
One of the most complicated skills you need to learn in your trig class is how to graph sine and cosine functions. This scares a lot of students, but you can tame this process if you make one simple observation: Every sine and cosine curve has exactly the same shape! No matter the amplitude or period or phase shift, the curve looks just like this:


You only need to place the graph in its proper position on the coordinate axes. This is (mostly) easy to accomplish if you can remember only two things about the sine and cosine parent curves:

1)     The sine curve y = sin x “starts” at the origin and goes up to its maximum, while the cosine curve y = cos x “starts” at its maximum.


2)     For either curve, you can break one period into four equal intervals. At each interval, the curve moves from its midline to the maximum to the midline to the minimum to the midline to the maximum to… over and over again. So all you need to do is find the starting point, and plot the points on the curve at each ¼-period interval.

We will always write our functions in standard form:

f(x) = A \; sin(Bx+C) + D \; or \; f(x)= A \; cos(Bx+C) + D

(Note that some textbooks prefer to write the formula in a slightly different form:

f(x) = A \; sin(B(x+C)) + D \; or \; f(x)= A \; cos(B(x+C)) + D

We will discuss how that affects your work below.)

Each of the constants A, B, C & D affects the position of the curve and you need to analyze this before you graph the curve. Let’s look at each of them in turn:

A: The absolute value of this number tells you the amplitude of your curve.

B: The period of your curve is determined by dividing 2\pi by B.

C: The phase shift is found by dividing -C by B. A positive value means the phase shift is to the right. A negative value means the phase shift is to the left. (If your class uses the version of the equation above with the B factored out, then the phase shift is equal to C.)

D: The vertical shift is equal to D.

Here’s an example to show how you would calculate all these values.

\displaystyle f(x) = -3 \sin (2x + \frac{\pi}{2}) -1

Here, A = -3; B = 2; C = \pi/2 ; and D = -1. Therefore,

Amplitude = |-3| = 3

Period = 2 \pi /2 = \pi

Phase shift = - (\pi /2)/2 = - \pi /4  (that is, \pi /4 units to the left)

Vertical shift = -1

When you need to graph a sine or cosine curve, always determine these four values first. Then you are ready to graph the function. We’ll do that in our next post.

Algebra 2, Precalc/Trig

Using tree diagrams to find conditional probabilities

By Tutor GuyNo Comments


Those problems that ask you to find the probability of a series of events “without replacement” can be scary because the probabilities of each event keep changing. (These are known as conditional probability problems.) If the number of possible outcomes isn’t too large, you can tame these problems by using a tree diagram to simplify your calculations.

  1. For the first event, draw a tree branch for each possible outcome.
  2. At the end of each branch, draw a tree branch for each possible outcome of the second event.
  3. Continue until you have a column for every event.
  4. For every branch on the tree, write down the probability of that event occurring at that location.
  5. Then multiply all the branches from first event to last event to find the probability of any one outcome.
  6. Add various events together to get the probability of any compound outcome.

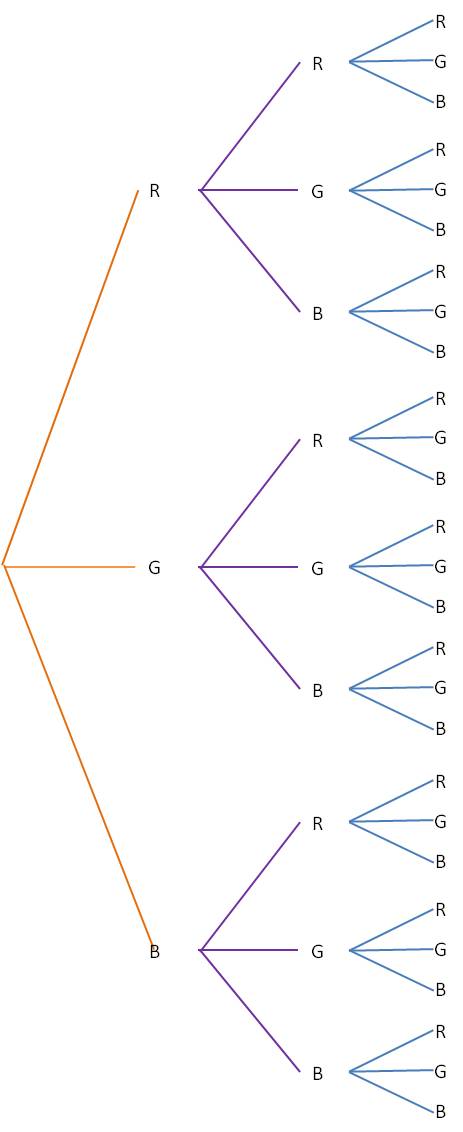
Here’s a simple example that shows how this process works. Let’s say you have a candy dish with 10 red candies, 15 green candies and 20 blue candies. You want to know the probability that you draw at least two red candies or at least two blue candies. There are a lot of different possibilities here, but a tree diagram simplifies everything greatly. Start by drawing a tree with every possible outcome (R, G and B in this example). Then from each outcome, draw another tree representing each outcome for the second draw. Repeat for the third draw. Your tree will look like this:
st-0501-tree


(You can see that this process will get pretty unwieldy if there are too many outcomes or too many events.)

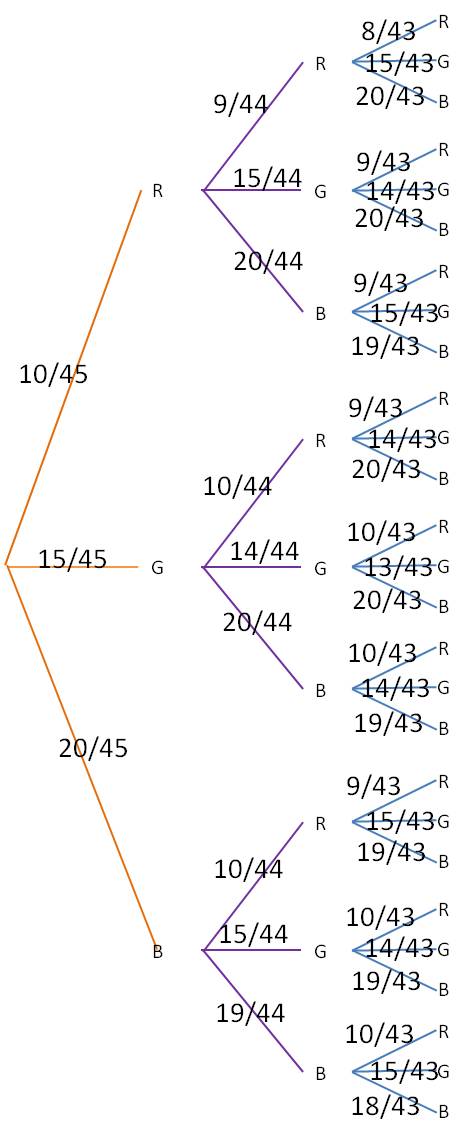
Next, label each branch with the probability for that outcome. Note that the probabilities change depending on which outcomes have already occurred. For our example, the tree would now look like this:
st-0502-tree


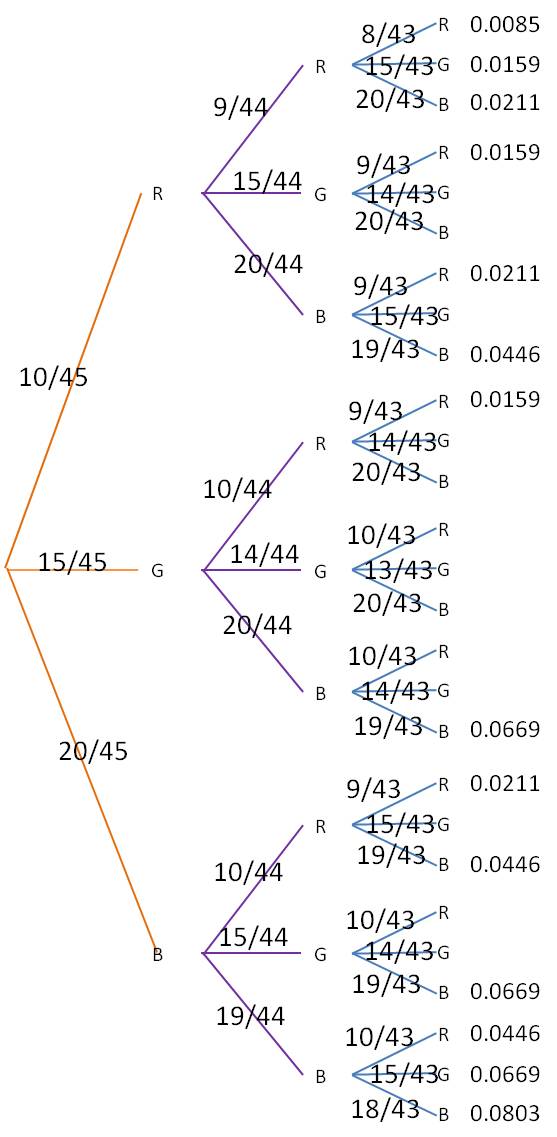
Finally, for each of the branch ends at the right, multiply together all the probabilities leading to that endpoint. For example, the very top branch, which represents RRR, you would multiply 10/45*9/44*8/43 to find the probability of getting a red candy on all three draws. The final table looks like this (to make the table easier to read, we have calculated only those branches that represent at least two reds or at least two blues):
st-0503-tree


The probability of our desired event is then the sum of all of listed probabilities: 0.5352.

Algebra 2, Statistics

Integrals involving trig substitutions

By Tutor GuyNo Comments


When is it appropriate to solve an integral with a trig substitution? First of all, keep in mind that a trig substitution doesn’t always work. Even when it does work, you are often left with an integral that will require other techniques such as a u substitution or integration by parts. But if you are willing to put in a little effort (and you know your trig identities), trig substitutions allow you to find the antiderivatives of some rather complicated functions.

There are three conditions that you look for—each a radical term of a particular form in the integrand. Each condition is associated with a different substitution. After you make the substitution, you simplify the integrand and go from there.

Term

Substitution

Radical becomes…

\sqrt{a^2-x^2} \text{Let } x=a \sin \theta; \, dx=a \cos \theta \,d \theta a \cos \theta
\sqrt{a^2+x^2} \text{Let } x=a \tan \theta; \, dx=a \sec^2 \theta \,d \theta a \sec \theta
\sqrt{x^2-a^2} \text{Let } x=a \sec \theta; \, dx=a \sec \theta \tan \theta \,d \theta a \tan \theta


Before we look at some example integrals, let’s see why the first radical term above simplifies to a \cos \theta. It’s pretty straightforward if you know your trig identities:

\sqrt{a^2-x^2}=\sqrt{a^2-(a \sin \theta)^2}= \sqrt{a^2-a^2 \sin^2 \theta}= \sqrt{a^2(1- \sin^2 \theta)} =

 …….. \sqrt{a^2 \cos^2 \theta} = a \cos \theta

Example. Integrate the following:

\text{a.} \displaystyle \int \frac{dx}{\sqrt{1-x^2}} \qquad \text{b.} \int \frac{x^3}{8 \sqrt{4+x^2}}dx \qquad \text{c.} \int x \sqrt{x^2-4} \; dx

Solutions:

  1. (Does this integral look familiar?) Here, a=1, so use x= \sin \theta. Using the first line of the table above:
    …..
    \displaystyle \int \frac{dx}{\sqrt{1-x^2}}= \int \frac{\cos \theta \, d \theta}{\cos \theta}= \int d \theta = \theta +C
    …..
    But since x= \sin \theta, \theta=\sin^{-1} x.
    …..
    \therefore \displaystyle \int \frac{dx}{\sqrt{1-x^2}}=\sin^{-1} x+C
  2. Here, a=2 and we use line 2 from the table above (x=2 \tan \theta). Note that x^3=8 \tan^3 \theta. Upon substitution,
    …..
    \displaystyle \int \frac{x^3}{8 \sqrt{4+x^2}}\, dx= \int \frac{8 \tan^3 \theta}{8(2 \sec \theta)}2 \sec^2 \theta \, d \theta = \int \tan^3 \theta \sec \theta \, d \theta
    …..
    Hmm. This is going to take a little bit of extra work… Time to pull out some trig identities:
    …..
    \int \tan^3 \theta \sec \theta \, d \theta = \int \tan^2 \theta \tan \theta \sec \theta \, d \theta = \int (\sec^2 \theta -1) \tan \theta \sec \theta \, d \theta
    …..
    Now a u substitution, letting u= \sec \theta:
    …..
    \displaystyle \int (u^2-1) \, du= \frac{1}{3} u^3-u+C= \frac{1}{3} \sec^3 \theta - \sec \theta +C
    …..
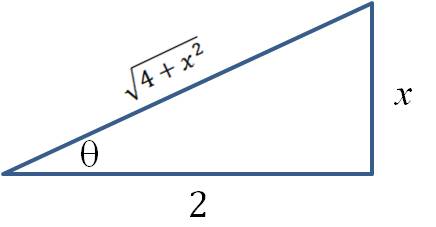
    How do we get our answer back in terms of x? Draw a triangle that shows how x and \tan \theta are related, then use the Pythagorean theorem to find an expression for \sec \theta. In the triangle below,
    …..
    x=2 \tan \theta \therefore \sec \theta = \dfrac{\sqrt{4+x^2}}{2}
    Substitute into the integral above to get:
    \displaystyle \int \frac{x^3}{8 \sqrt{4+x^2}} dx=\frac{1}{3} \sec^3 \theta - \sec \theta +C= \frac{(4+x^2)^{3/2}}{24}- \frac{(4+x^2)^{1/2}}{2}+C

    This can be simplified further by factoring:
    …..
    \displaystyle \int \frac{x^3}{8 \sqrt{4+x^2}}dx= \frac{(4+x^2)^{3/2}}{24}- \frac{(4+x^2)^{1/2}}{2}+C= \frac{1}{24}(x^2-8) \sqrt{4+x^2}
    …..
    Whew!

  3. This is a trick question. Even though it fits the condition given in the table (and you could integrate with a trig substitution if you wanted), it’s easier to do this one with a u substitution: u=x^2-4 and du=2x \; dx:
    …..
    \displaystyle \int x \sqrt{x^2-4} \, dx= \frac{1}{2} \int \sqrt{u} \, du= \frac{1}{3}u^{3/2}+C= \frac{1}{3}(x^2-4)^{3/2}+C

The lesson here is to look for u substitutions before you look for trig substitutions.

Calculus

Using f”(x) to interpret f’(x)

By Tutor GuyNo Comments


You know that the second derivative of a function is used to characterize the concavity of the function. But did you know that the second derivative also gives you information about the first derivative? Well, of course it does, because the second derivative is the first derivative of the first derivative. To put it simply, when the second derivative is positive, that means the first derivative is increasing. When the second derivative is negative, the first derivative is decreasing.

But wait, I thought when the second derivative is positive, that means the original function is concave up! Well, yes, that’s true too. So that means wherever a function is concave up, its first derivative is increasing. And wherever a function is concave down, the first derivative is decreasing.

This is another way you can analyze the behavior of a function.

Calculus

Calculating the probability of an event by its complement

By Tutor GuyNo Comments


You will often be asked to calculate the probability of a compound event; that is, an event that contains two or more simple outcomes. For example, if you flip five coins, what is the probability that you get either four or five heads? To solve this problem, you calculate the probability of getting exactly four heads and the probability of getting exactly five heads, then add the numbers together:

P(x=4 \text{ or } x=5)=P(x=4)+P(x=5)=

\displaystyle \binom{5}{4} \! \left ( \dfrac{1}{2} \right )^4 \!\! \left ( \dfrac{1}{2} \right)^1+ \binom{5}{5} \! \left (\dfrac{1}{2} \right )^5 \!\! \left ( \dfrac{1}{2} \right )^0= \dfrac{5}{32}+ \dfrac{1}{32}= \dfrac{6}{32}= \dfrac{3}{16}

But what if a compound event contains a lot of simple events? For example, if you roll ten dice, what is the probability you get at least two sixes? To solve this the way we did the previous example, we would need to find the probability of getting exactly two sixes, the probability of getting exactly three sixes, and so on, up to the probability of getting exactly 10 sixes. Although the calculations are not difficult, it is very tedious to find nine different probabilities in order to add them all together. For this problem, it is much simpler to calculate the complement of the given event. The complement of “at least two sixes” is “at most one six”. So calculate the probability of getting at most one six when you roll ten dice:

P(x=0 \text{ or } x=1)=P(x=0)+P(x=1)=

\displaystyle \binom{10}{0} \! \left ( \frac{1}{6} \right )^0 \!\! \left ( \frac{5}{6} \right )^{10}+ \binom{10}{1} \! \left ( \frac{1}{6} \right )^1 \!\! \left ( \frac{5}{6} \right )^9=0.1615+0.3230=0.4845

Because the probability of an event A and its complement (not A) add up to 1, the probability of getting at least two sixes is then 1-0.4845=0.5155.

Calculating a compound probability by finding the probability of the complement instead is the basis of many problems in statistics. It’s up to you to determine when this is the best approach to solving a problem.

Statistics

Using multiplicity of factors to characterize graphs of rational functions

By Tutor GuyNo Comments


Rational functions can be scary because there are so many details to manage. Check other posts on this website for information on how to graph rational functions. In this post, I look at one small clue that can help you figure out the behavior of a rational function as it approaches the vertical asymptotes. All you need to do is check the multiplicity of the factor in the denominator.

If the multiplicity of the factor is even, then the graph approaches +∞ from both sides of the asymptote, or it approaches -∞ from both sides of the asymptote.

If the multiplicity of the factor is odd, then the graph approaches +∞ on one side of the asymptote and approaches -∞ on the other side.

Here is an example that demonstrates this property:

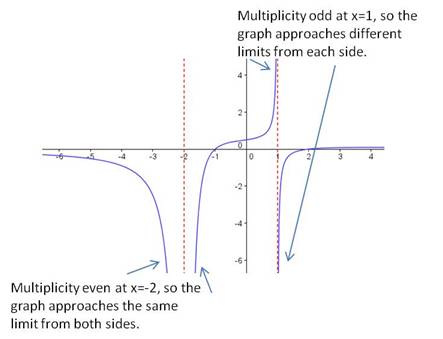
\text{Graph } \dfrac {(x-2)(x+1)}{(x-1)(x+2)^2}

There are two vertical asymptotes for this function, at x=-2 and at x=1. The (x+2) factor is multiplicity 2 (even), so the graph approaches the same limit from both sides of the asymptote. The (x-1) factor is multiplicity 1 (odd), so the graph approaches opposite limits on either side of the asymptote. Here is the graph of the function, demonstrating this property:

Algebra 2, Precalc/Trig

Using multiplicity of factors to characterize graphs of polynomials

By Tutor GuyNo Comments


When you are asked to sketch the graph of a polynomial, you do not want to make a tree to calculate the values of various points. You don’t know where the “turning points” are, so you won’t be able to connect the dots for the points you plot. Instead, you need to fully factor the polynomial and use the zeroes you find to draw the polynomial. In addition, the multiplicity of each factor tells you whether the polynomial crosses the x-axis at that zero or “bounces”. The rule is very simple: If the factor has an odd multiplicity, the graph crosses the x-axis. If the multiplicity is even, the graph bounces.

multiplicity behavior at x ‑axis
odd crosses
even bounces


Example: Sketch the graph of

f(x)=x^3(x+1)(x-1)^2

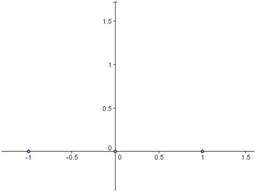
Solution: First of all, plot the zeroes. For this problem, the zeroes are at x=-1, x=0, \text{ and } x=1.


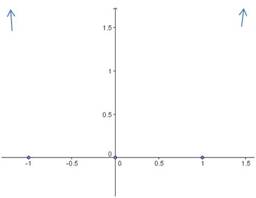
Next, determine the degree of the polynomial. In this case, it is degree 6. (Add the exponents of all the factors: 3+1+2=6.) The degree tells you the end behavior, and you can draw arrows to show that the function will go to positive infinity on the left and the right.


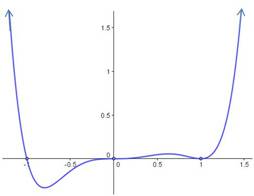
Now you can sketch the graph. At x=-1, the zero is multiplicity 1, so the graph crosses the x-axis. At x=0, the zero is multiplicity 3, so the graph also crosses the x-axis. Note that for multiplicity 3, the graph doesn’t cross straight through the axis, but flattens out as it goes through. At x=1, the zero is multiplicity 2, so the graph bounces at the x-axis. The final sketch is shown below:

Algebra 2, Precalc/Trig

Using force and torque to solve motion problems

By Tutor GuyNo Comments


When solving motion problems in physics, start by drawing a picture of the situation. Then use the picture to create an FBD. If there are no rotations, set the linear forces equal to ma and solve. If there are rotations, set the linear forces equal to ma and set all the torques equal to I \alpha. Then solve the equations.

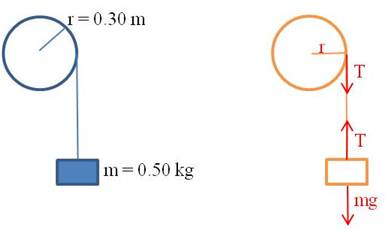
Example 1: A block of mass 0.50 \, kg is attached to the end of a string of negligible mass wrapped around a wheel of radius 0.30 \, m as shown. If the wheel has a moment of inertia of 0.18 \, kg \cdot m^2, find the acceleration of the mass as it falls.


We can find all the information we need by writing the linear and rotational equations of force. The block is experiencing only linear motion, so there is one equation for it. The two forces acting on it are gravity and the tension in the string:

mg-T=ma

The wheel is experiencing only rotational motion, so there is only one equation for it too. The only torque acting on the wheel is due to the tension in the string:

\tau=F \cdot r=Tr=I \alpha

It appears at first as though there are too many unknowns: T, a, \text{ and } \alpha. But remember that a=r \alpha. So we can write the second equation as:

Tr=I \alpha =I \dfrac{a}{r}

 Solve both equations for T and substitute:

mg-ma=I \dfrac{a}{r^2} \rightarrow mg=I \dfrac{a}{r^2}+ma

\therefore a= \dfrac{mg}{\dfrac{I}{r^2}+m}= \dfrac{0.50 \cdot 9.8}{\dfrac{0.18}{0.30^2}+0.50}=2.0 \, m/s^2


Physics
Blue Taste Theme created by Jabox