Those problems that ask you to find the probability of a series of events “without replacement” can be scary because the probabilities of each event keep changing. (These are known as conditional probability problems.) If the number of possible outcomes isn’t too large, you can tame these problems by using a tree diagram to simplify your calculations.
- For the first event, draw a tree branch for each possible outcome.
- At the end of each branch, draw a tree branch for each possible outcome of the second event.
- Continue until you have a column for every event.
- For every branch on the tree, write down the probability of that event occurring at that location.
- Then multiply all the branches from first event to last event to find the probability of any one outcome.
- Add various events together to get the probability of any compound outcome.
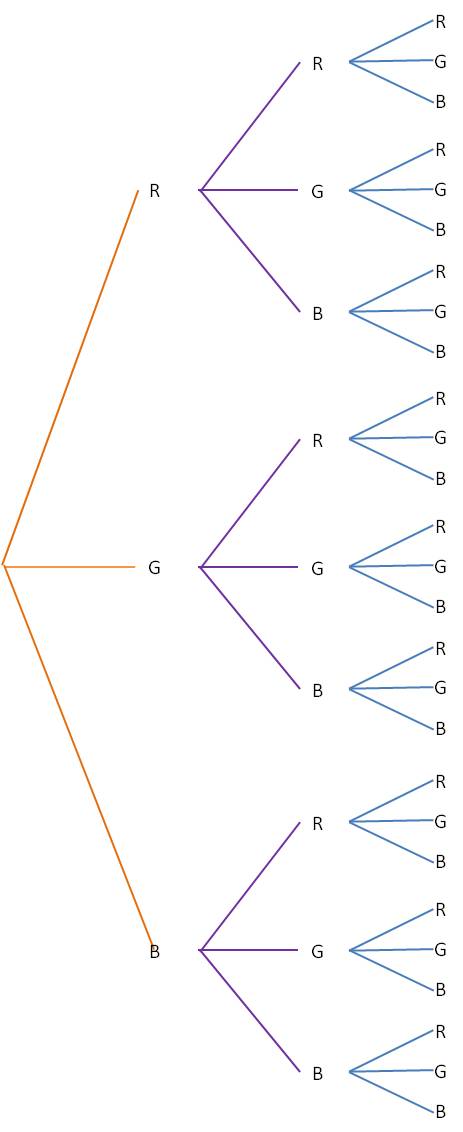
Here’s a simple example that shows how this process works. Let’s say you have a candy dish with 10 red candies, 15 green candies and 20 blue candies. You want to know the probability that you draw at least two red candies or at least two blue candies. There are a lot of different possibilities here, but a tree diagram simplifies everything greatly. Start by drawing a tree with every possible outcome (R, G and B in this example). Then from each outcome, draw another tree representing each outcome for the second draw. Repeat for the third draw. Your tree will look like this:

(You can see that this process will get pretty unwieldy if there are too many outcomes or too many events.)
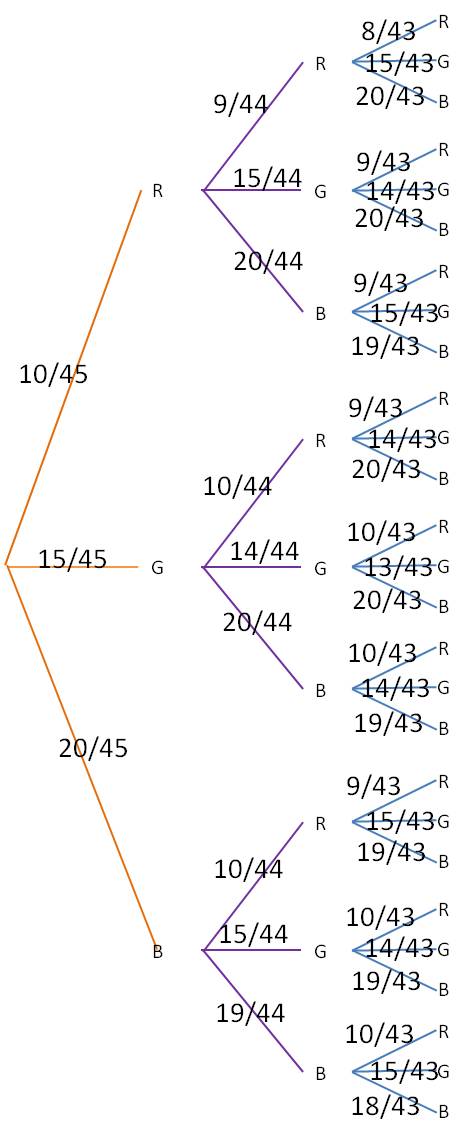
Next, label each branch with the probability for that outcome. Note that the probabilities change depending on which outcomes have already occurred. For our example, the tree would now look like this:

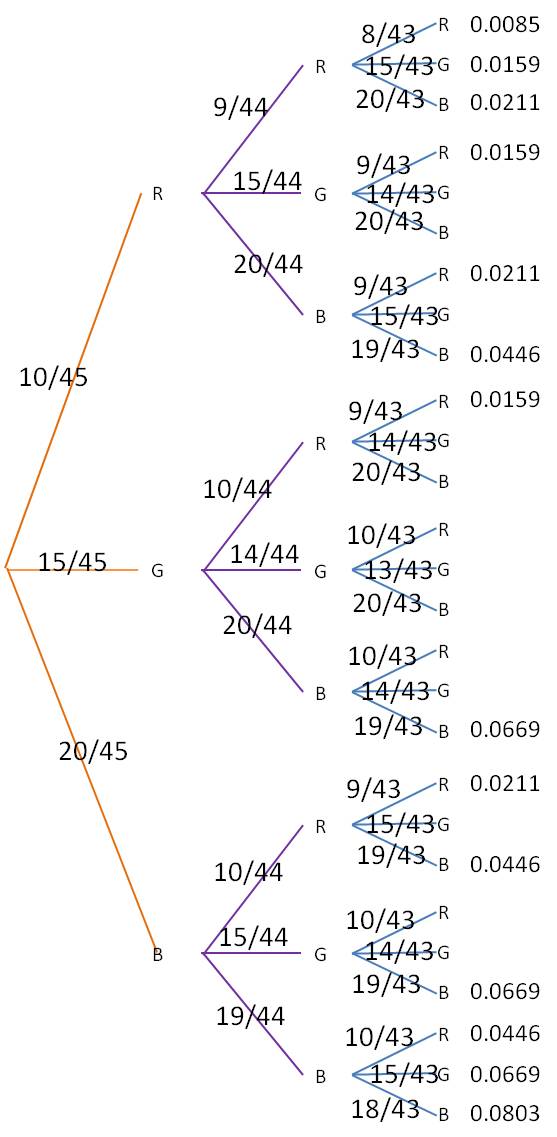
Finally, for each of the branch ends at the right, multiply together all the probabilities leading to that endpoint. For example, the very top branch, which represents RRR, you would multiply 10/45*9/44*8/43 to find the probability of getting a red candy on all three draws. The final table looks like this (to make the table easier to read, we have calculated only those branches that represent at least two reds or at least two blues):

The probability of our desired event is then the sum of all of listed probabilities: 0.5352.
