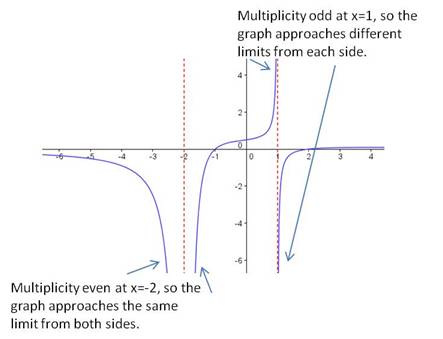
Rational functions can be scary because there are so many details to manage. Check other posts on this website for information on how to graph rational functions. In this post, I look at one small clue that can help you figure out the behavior of a rational function as it approaches the vertical asymptotes. All you need to do is check the multiplicity of the factor in the denominator.
If the multiplicity of the factor is even, then the graph approaches +∞ from both sides of the asymptote, or it approaches -∞ from both sides of the asymptote.
If the multiplicity of the factor is odd, then the graph approaches +∞ on one side of the asymptote and approaches -∞ on the other side.
Here is an example that demonstrates this property:
There are two vertical asymptotes for this function, at and at
The
factor is multiplicity 2 (even), so the graph approaches the same limit from both sides of the asymptote. The
factor is multiplicity 1 (odd), so the graph approaches opposite limits on either side of the asymptote. Here is the graph of the function, demonstrating this property:

