Archive

Using multiplicity of factors to characterize graphs of rational functions

No Comments


Rational functions can be scary because there are so many details to manage. Check other posts on this website for information on how to graph rational functions. In this post, I look at one small clue that can help you figure out the behavior of a rational function as it approaches the vertical asymptotes. All you need to do is check the multiplicity of the factor in the denominator.

If the multiplicity of the factor is even, then the graph approaches +∞ from both sides of the asymptote, or it approaches -∞ from both sides of the asymptote.

If the multiplicity of the factor is odd, then the graph approaches +∞ on one side of the asymptote and approaches -∞ on the other side.

Here is an example that demonstrates this property:

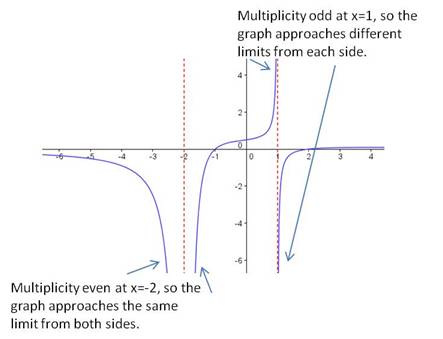
\text{Graph } \dfrac {(x-2)(x+1)}{(x-1)(x+2)^2}

There are two vertical asymptotes for this function, at x=-2 and at x=1. The (x+2) factor is multiplicity 2 (even), so the graph approaches the same limit from both sides of the asymptote. The (x-1) factor is multiplicity 1 (odd), so the graph approaches opposite limits on either side of the asymptote. Here is the graph of the function, demonstrating this property:

Using multiplicity of factors to characterize graphs of polynomials

No Comments


When you are asked to sketch the graph of a polynomial, you do not want to make a tree to calculate the values of various points. You don’t know where the “turning points” are, so you won’t be able to connect the dots for the points you plot. Instead, you need to fully factor the polynomial and use the zeroes you find to draw the polynomial. In addition, the multiplicity of each factor tells you whether the polynomial crosses the x-axis at that zero or “bounces”. The rule is very simple: If the factor has an odd multiplicity, the graph crosses the x-axis. If the multiplicity is even, the graph bounces.

multiplicity behavior at x ‑axis
odd crosses
even bounces


Example: Sketch the graph of

f(x)=x^3(x+1)(x-1)^2

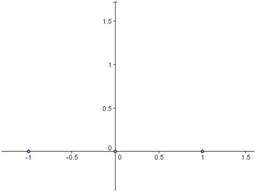
Solution: First of all, plot the zeroes. For this problem, the zeroes are at x=-1, x=0, \text{ and } x=1.


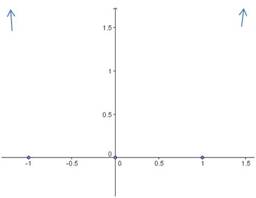
Next, determine the degree of the polynomial. In this case, it is degree 6. (Add the exponents of all the factors: 3+1+2=6.) The degree tells you the end behavior, and you can draw arrows to show that the function will go to positive infinity on the left and the right.


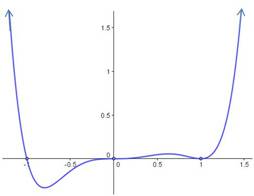
Now you can sketch the graph. At x=-1, the zero is multiplicity 1, so the graph crosses the x-axis. At x=0, the zero is multiplicity 3, so the graph also crosses the x-axis. Note that for multiplicity 3, the graph doesn’t cross straight through the axis, but flattens out as it goes through. At x=1, the zero is multiplicity 2, so the graph bounces at the x-axis. The final sketch is shown below:

Blue Taste Theme created by Jabox