
When graphing a sine or cosine curve, the first thing you must do is determine the amplitude, period, phase shift and vertical shift. See my previous post (Graphing Sine and Cosine Functions – Intro) if you need help with this analysis. In this post, we will graph the function
 = -3 \sin (2x + \frac{\pi}{2}) -1")
We quickly determine the four values we need:
Amplitude = |-3| = 3
Period =

Phase shift = /2 = - \pi/4")

Vertical shift = -1
This is all the information we need in order to complete the graph. Just follow this procedure step-by-step.
1. Put values on the coordinate axes. On the y-axis, you typically make each square equal to one unit, but you can change this if you want. To determine the scale on the x-axis, take the period and divide by 4. This will be the scale on the x-axis. In our example, the period is  , so each square will be . The vertical axis will be one unit per square. What do you do if your teacher gives you a grid with the numbers already in place? You should get a blank piece of graph paper and do your own grid! , so each square will be . The vertical axis will be one unit per square. What do you do if your teacher gives you a grid with the numbers already in place? You should get a blank piece of graph paper and do your own grid!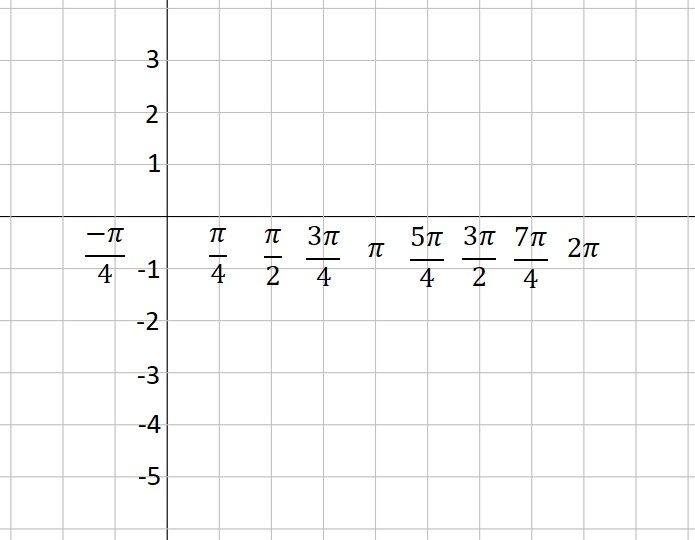 |
2. Use the vertical shift to draw a dashed line across the figure. This is the location of the midline of your graph. In our example, the vertical shift is -1, so we draw a dashed line at y= -1.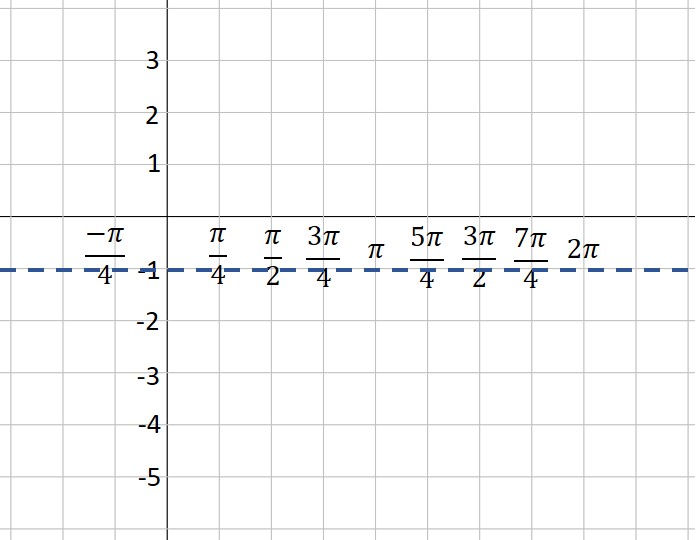 |
3. Use the amplitude to draw two more dashed lines—one above the midline and one below. These represent the maximum and minimum values of your function. In our example, the amplitude is 3. Three units above -1 is 2—that’s our maximum dashed line. Three units below -1 is -4—that’s where our minimum is located.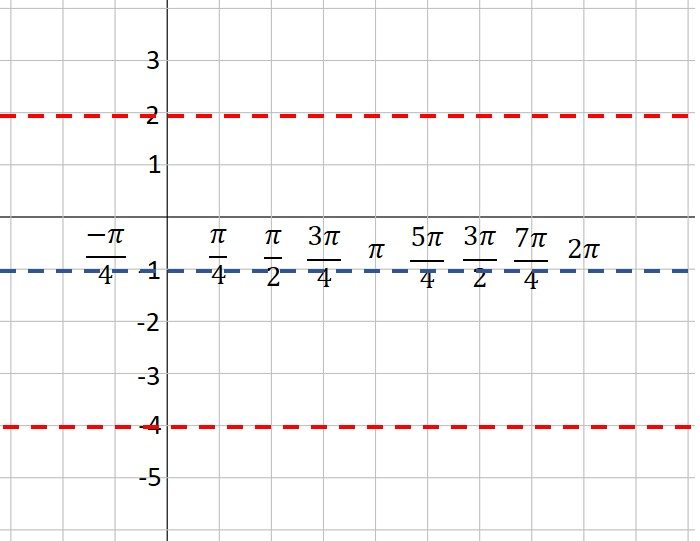 |
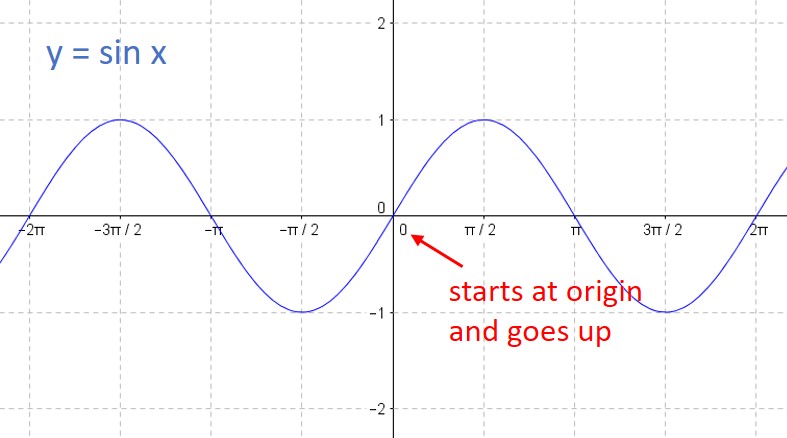
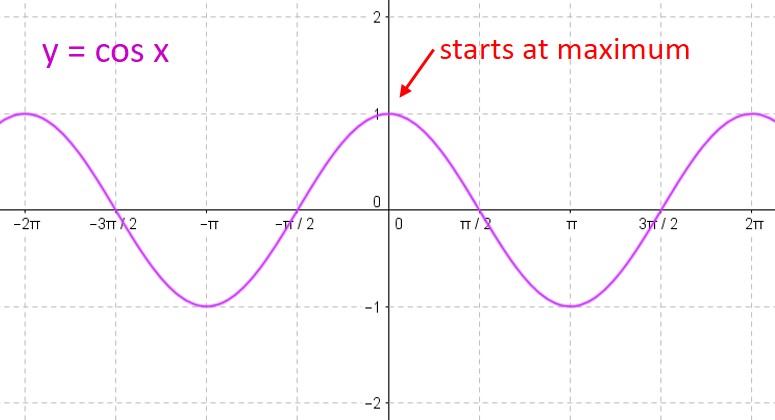
4. Plot the starting point of your graph, using the vertical shift and phase shift as a guide. Our function is a sine curve, which starts at the midline. The phase shift is to the left, so our initial point is units left of the y-axis. If our function had been a cosine curve, our initial point would be plotted on the maximum line instead of the midline (or on the minimum line if A is negative). It’s hard to see, but note that I’ve placed a green dot at the “start” point; the coordinates are .") 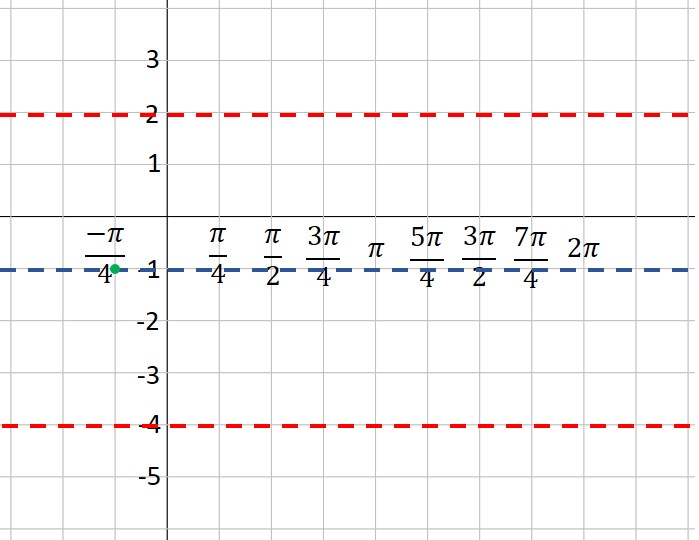 |
5. Moving one square to the right at a time (because each square is one quarter of a period), plot points at the maximum, midline, minimum and midline. This is one period of your function. If you want to graph more than one period, continue the process. In our example, we’ve plotted points for two complete periods. Note that because A is a negative number (-3), our first point after the starting point is at the minimum instead of the maximum. Look closely, and you will see that I’ve placed a green dot every square to the right of our first point.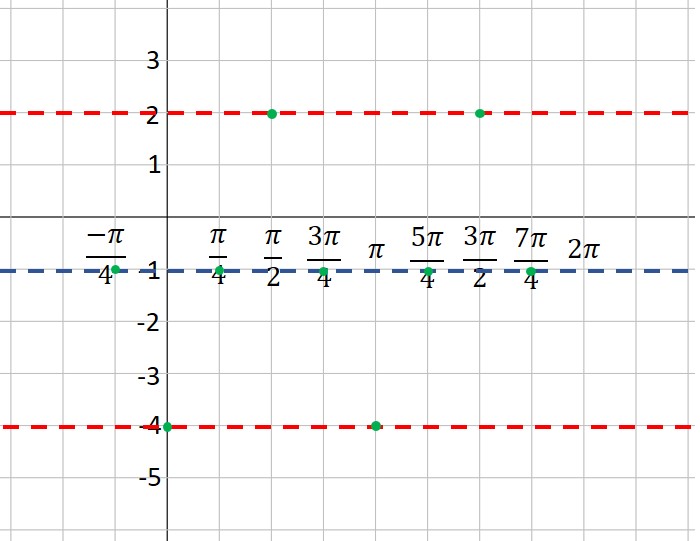 |
6. Connect the dots with a nice smooth curve. You’ve graphed the sine curve like a pro!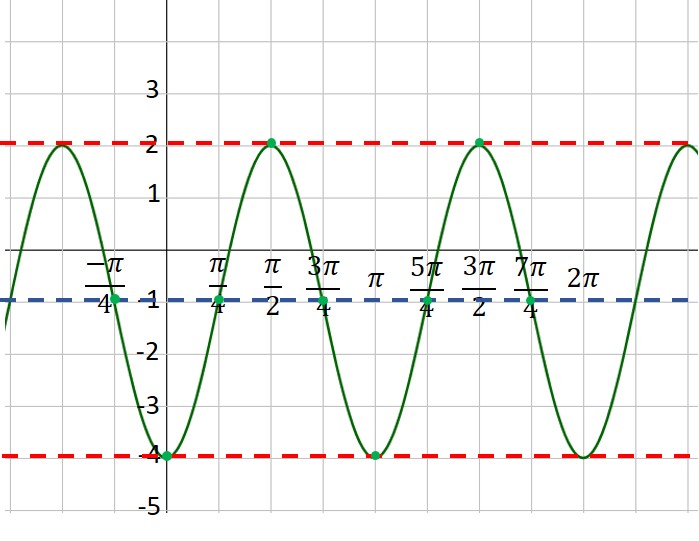 |

 = A \; sin(Bx+C) + D \; or \; f(x)= A \; cos(Bx+C) + D")
 = A \; sin(B(x+C)) + D \; or \; f(x)= A \; cos(B(x+C)) + D")
 by B.
by B. ; and D = -1. Therefore,
/2 = - \pi /4") (that is,
(that is,  units to the left)
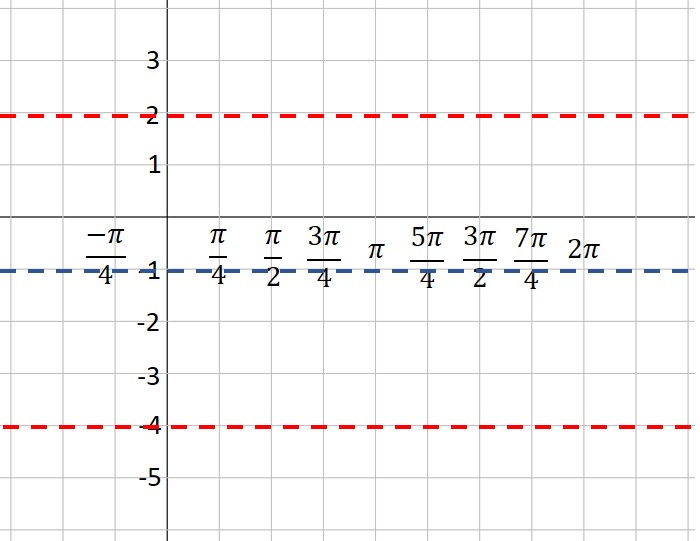