In previous posts, I described the steps you follow to analyze a rational function. If you follow these steps, you can be a rational function superstar too. In this post, I put all the pieces together to show how you use the information you’ve obtained to plot the graph. [For details on how to execute the various steps, please see other posts on this website.]
Example: Graph the following rational function.
Solution: We break this into many steps.
1. Find the -intercept:
2. Fully factor the function:
3. Find the vertical asymptotes, if any:
The vertical asymptotes are at and
.
4.Find the -intercept(s), if any:
@
and
5. Find the hole(s), if any:
There is a hole at the point
6. Find the horizontal or oblique asymptote, if any, or characterize the end behavior:
The horizontal asymptote is at
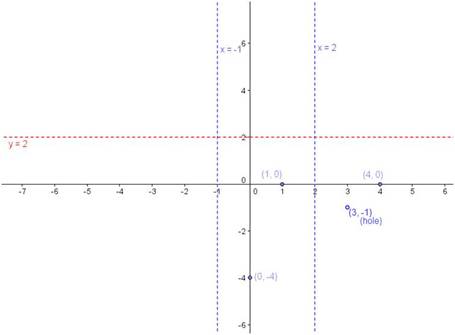
7. Place all of this information on the graph:
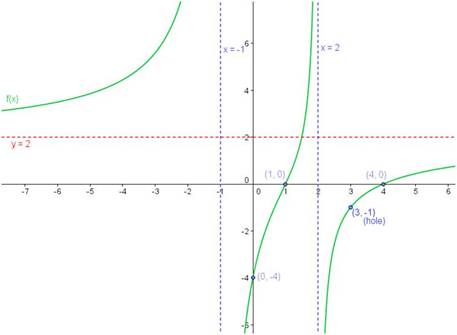
8. Use all the information you have plotted to complete the graph of the function:


