
As a reaction proceeds, we can measure the concentration of a reactant at various times. Then we use this data to determine the reaction order. For example, here’s the data for some arbitrary reaction during its first 30 seconds:
| Time (s) | [A] (M) |
| 0 | 0.100 |
| 5 | 0.0632 |
| 10 | 0.0400 |
| 15 | 0.0253 |
| 20 | 0.0160 |
| 25 | 0.0101 |
| 30 | 0.0064 |
To find the reaction order, we create three graphs. One is [A] vs. time, a second is ln [A] vs. time and the third is 1/[A] vs. time. If the first graph is linear, the reaction is zeroth order with respect to [A]. If the ln of concentration graph is linear, the reaction is first order, and if the reciprocal concentration graph is linear, the reaction is second order. In the old days (before calculators), we would calculate all the numbers and graph the data by hand and hope that one was obviously linear. Here, I used my graphing calculator to quickly generate three scatter graphs, shown below:

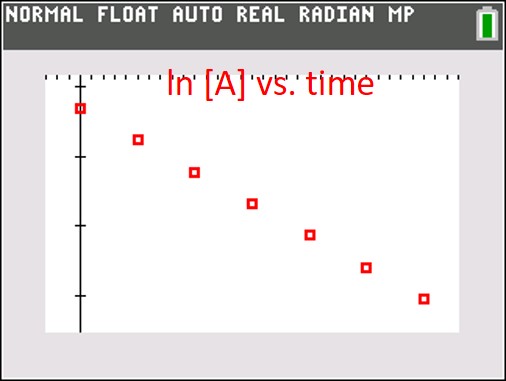

It should be pretty obvious that the red graph (ln [A] vs time) is the only linear graph, and that means the reaction is first order with respect to [A]. The rate equation is thus: rate = k[A] and the absolute value of the slope of the line (found using a linear regression) is the rate constant k.
What if the data has a bit of variability in it and the data doesn’t fit perfectly on a straight line on any of the three graphs? With your graphing calculator, create the three scatter graphs as I did above, then perform a linear regression on each graph. The graph with r2 closest to 1.0 will be the correct graph.