When you are given the initial concentrations of the components in a reaction and you want to know the final concentrations at equilibrium, an ICE chart can be very useful. The ICE chart (some teachers call it an OCE chart or an IΔE chart) is a tool that helps you set up the proper algebraic expression in order to calculate the concentration change of each compound. It’s based on a very simple concept: the initial concentration of a compound plus the change in concentration of that compound must equal its final (equilibrium) concentration. To set up an ICE chart, follow these easy rules:
- Write out the balanced equilibrium equation.
- On the first line (I), put down the initial concentrations of each compound. If a compound is not in the initial mix, write 0. Be sure that you calculate the molarity, and not just the number of moles.
- Pick a direction for the reaction to proceed. It’s usually pretty obvious, but if you aren’t sure which way the reaction will go, just choose one direction. It doesn’t matter if you guess wrong.
- On the second line (C), use a variable to write the change in concentration for each compound using the balanced equation as a guide. For each compound that is consumed, write –Ax, where A is the coefficient of the compound in the balanced reaction. For each compound that is being formed, write +Ax. See the example below.
- On the third line (E), write the sum of the first two lines. This must be the final concentration of each compound.
- Use the equilibrium law and the value of Kc to write an expression with the equilibrium concentrations. Then solve this equation for x.
- Use this value to determine the equilibrium concentrations of each compound. [Note: if the value of x is negative, this means you guessed wrong in step 3, and the reaction actually proceeds in the opposite direction. You will still get the correct final values of each compound if you add or subtract this negative value in this step.]
Example 1: 1.0 mole of H2 and 1.0 mole of I2 are placed in a 2.0 L flask. The following reaction takes place at 400°C: H2 (g) + I2 (g) → 2 HI (g). What are the concentrations of the three compounds at equilibrium? The Kc for the formation of hydrogen iodide (HI) from hydrogen and iodine gases is 64.1 at 400°C.
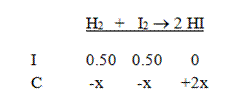
Solution: Start by writing the equation and the initial concentrations. Don’t forget to divide by the volume to find the molarities of all the compounds.
Next, put in the changes in concentration in terms of x. This reaction must go to the right, and we get two moles of HI for each mole of the reactants:
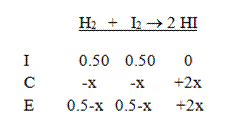
Then add the two columns to calculate to equilibrium concentrations:
Finally, write the equilibrium expression and solve:
Note that if you are given the change in concentration or the initial and final concentrations of a compound, you do not need to use an ICE chart. You can calculate the equilibrium values with a little bit of arithmetic. See the following example:
Example 2: The reaction in Example 1 is repeated at a different temperature with the same initial concentrations, and the final concentration of HI is determined to be 0.60 M. Determine the value of Kc at this new temperature.
Solution: To solve for Kc, we need to know the final concentrations of all three components. We are given the final value of HI, and knowing that we produced 0.60 M HI means that we must have lost 0.30 M of each of the reactants (use the balanced reaction to determine this). Since we started with 0.50 M of each, the final concentrations of each reactant must be 0.20 M (just subtract the numbers). So the equilibrium expression gives us:


