Graphing secant functions and cosecant functions can be daunting for students. But you can tame them if you recognize how they are related to graphs of sine and cosine functions. If you can graph the associated sine or cosine function, then secant and cosecant graphs will be pretty easy for you.
We will demonstrate this process with an example: Draw the graph of
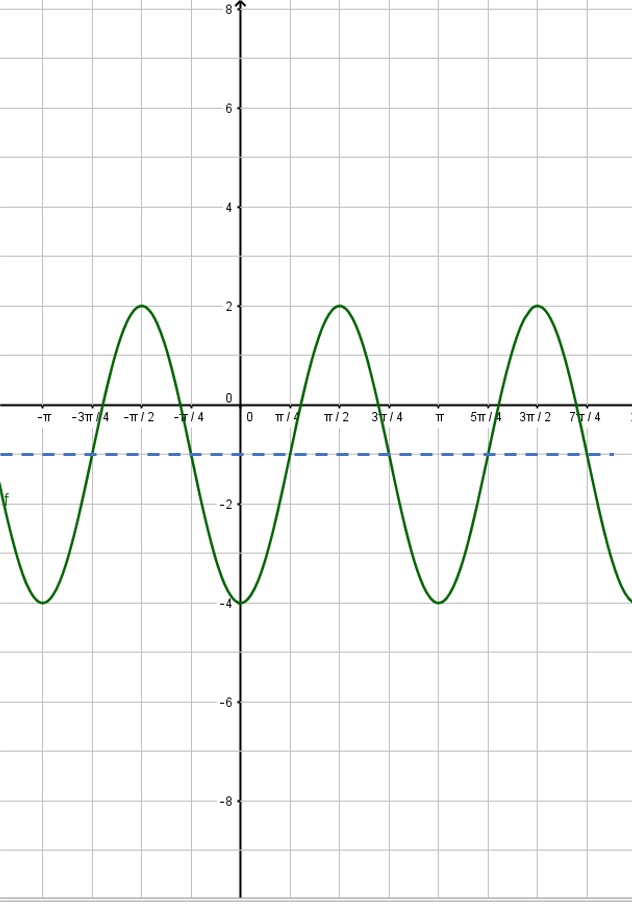
The first step for you is to graph a different function. If you are asked to graph a cosecant curve as in this example, change csc to sin and graph that instead. If you are graphing a secant function, change sec to cos and graph that instead. In our example, we will graph
I showed you how to graph sine and cosine functions in a previous post, so check that out if you need help. In that post, we graphed the sine function listed above. Here, we will assume you have already graphed the sine function:
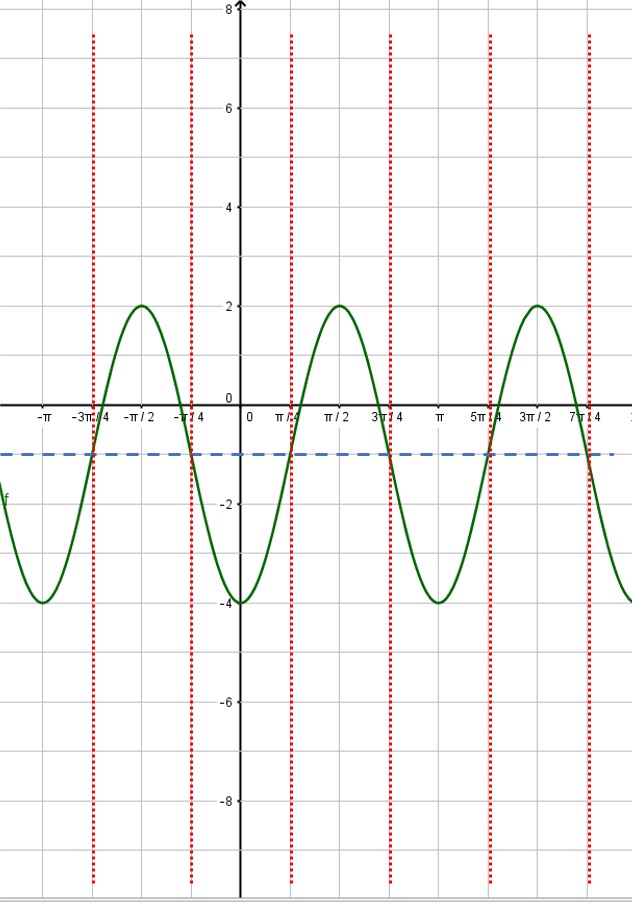
Next, put in the vertical asymptotes everywhere the sine curve crosses the midline:
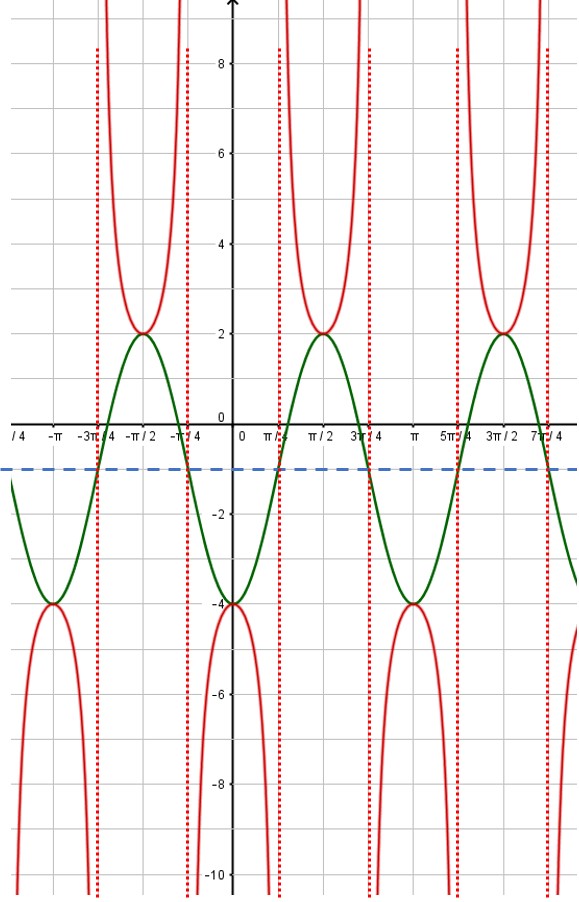
Then use the asymptotes to place the branches of the cosecant function. Also, notice that the minimum points of the cosecant curve touch the maximum points of the sine curve and vice versa:
That’s all there is to it! You can erase the sine curve (in green) or you can leave it. I usually draw in the sine or cosine curve in light pencil or as a dashed line, so that it is obvious which curve is the secant or cosecant curve. Here, the red curve is the graph we desire.


